Buckle up! 2021 is going to be a bumpy ride. If you haven’t noticed the volatility in your fixed income portfolios yet, it’s only a matter of time before it begins to worry you. No one is willing to talk about the fact that returns will be low and yet volatile in 2021. Surprisingly, there’s enough reason to stay invested. We’re happy to engage in these conversations with you.
Here’s what we’re covering in this note:
-
-
- YTM vs Returns – are YTMs a good way to set return expectations?
- Barbell strategies – how they work and should you invest?
- Perpetual bonds – what does the SEBI circular mean for your investments?
- Monetary Policy – How the US Federal Reserve is setting the tone for global monetary policy
-
YTM Versus Returns
Most investors pick their debt mutual funds based on the YTM (Yield To Maturity). YTM was used as an “indicative return” metric to market products. Let’s get into why this is misselling.
How is YTM Calculated?
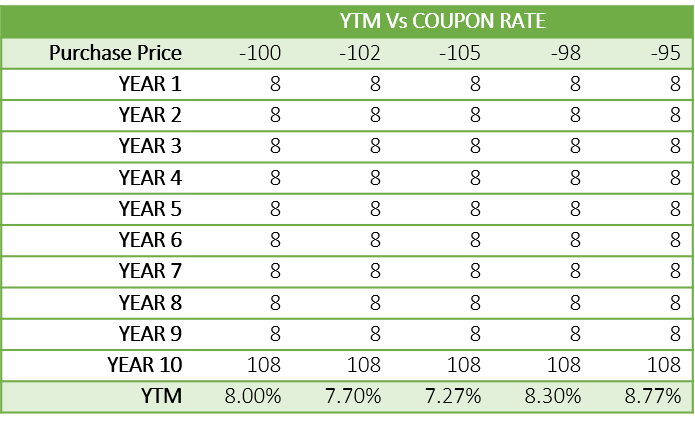
For a specific bond, the YTM is the return offered by the bond if it is held to maturity. What does this mean? Let’s say you have a 10-year bond whose face value is Rs. 100 and has a coupon or interest rate of 8%. This means whoever holds the bond earns Rs. 8 on it every year for the next ten years.
The bond’s YTM changes according to the price you pay. Meaning, if you pay more than Rs. 100 you earn less than 8% and if you pay less than Rs. 100, you earn more than 8%.
Interest Rates & Bond Valuation
We are told that bond prices and interest rates move in opposite directions. How exactly does this work?
Let’s work with the 8% bond in the previous example. Let’s say interest rates increase by 0.25%. A new bond issue with identical characteristics now offers a return of 8.25%. So, demand for the 8% bond would fall, and demand for the 8.25% bond would rise. When this happens, either investor will pay more than Rs. 100 for the 8.25% bond or less than Rs. 100 for the 8.00% bond. This creates an equilibrium where returns/yields from both bonds become identical. After all, why should you earn less if the risk-reward in both bonds is the same?
Using YTM in Debt Funds
YTM is important because it indicates the return from a bond if it is held to maturity. The underlying holdings in a debt fund are usually bonds, Certificates of Deposits, and Commercial paper. Fund managers calculate YTM to provide an indicative outlook of the cash flow, not returns.
Limitations of YTM
In an older note, we explained why yields only tell half the story. Yields shed more light on cash flows than returns. Here are some of the key limitations of YTM as an indicator of returns:
-
-
- YTM assumes that a bond is held to maturity. In most debt fund portfolios, bonds are traded regularly. The profits/losses made on these trades contribute to the returns but not the YTM.
- YTM does not highlight the underlying credit risk. For instance, a low-quality bond may have a high YTM. Now, if the borrower fails to pay interest, your return goes to 0% and will be nowhere close to the YTM.
- YTM doesn’t tell you how liquid a bond is. If it is a thinly traded security – there’s no price discovery. So, no one knows what the real value of the bond is and it also means your invested capital lacks easy access. This is one of the reasons SEBI is trying to change the way perpetual bonds are valued.
- YTM can’t predict interest rate movements. For example, right now short-term yields are well below the repo rate due to excess liquidity. The possibility of interest rates moving lower is minimal.
-
Fund Performance Versus YTM
In these graphs, we compare performance against YTM. This comparison illustrates how investors enter or exit fund categories with return expectations based on the YTM.
Short Duration Fund Performance Versus YTM
We calculated the returns of low-duration funds from February 2018 till February 2021 as compared with their YTMs. Each dot represents a fund with its YTM and annualised return.
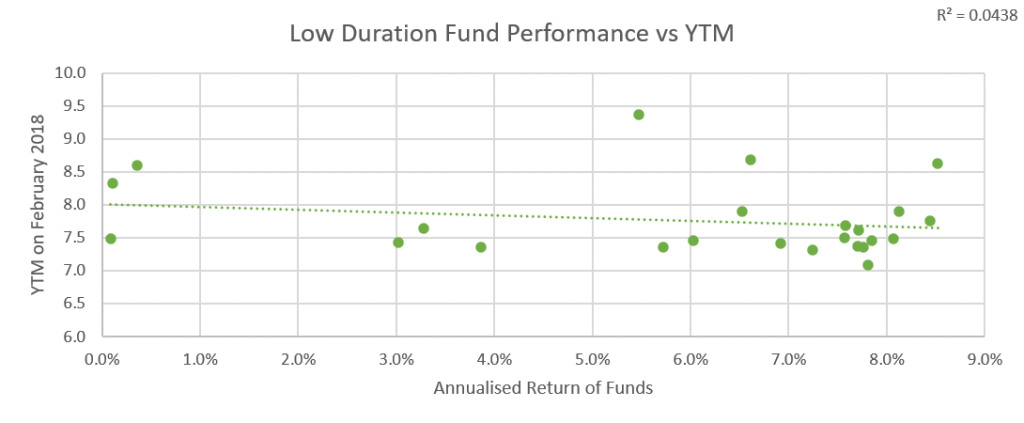
This graph shows us that some funds with high YTMs have delivered no returns. And some funds have delivered YTM-linked returns. This busts the myth that YTM is an accurate measure of return in low-duration funds. Overall, for the category, the co-efficient of correlation (R2) is close 0.04 (close to zero). This indicates that there’s no way of predicting returns from YTM.
Medium-to-Long Duration Fund Performance Versus YTM
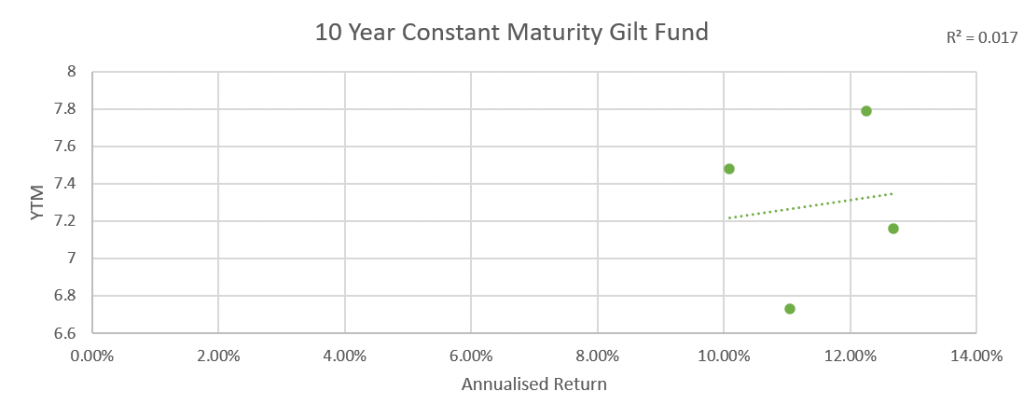
We calculated the 3-year rolling returns of a gilt fund from February 2013 till February 2021 as compared with its YTM. Again, we notice that yields don’t accurately predict returns. However, with a constant maturity gilt fund, the potential to earn higher returns is greater when the yields are higher. Returns on gilt funds are influenced by interest rates and macroeconomic factors.
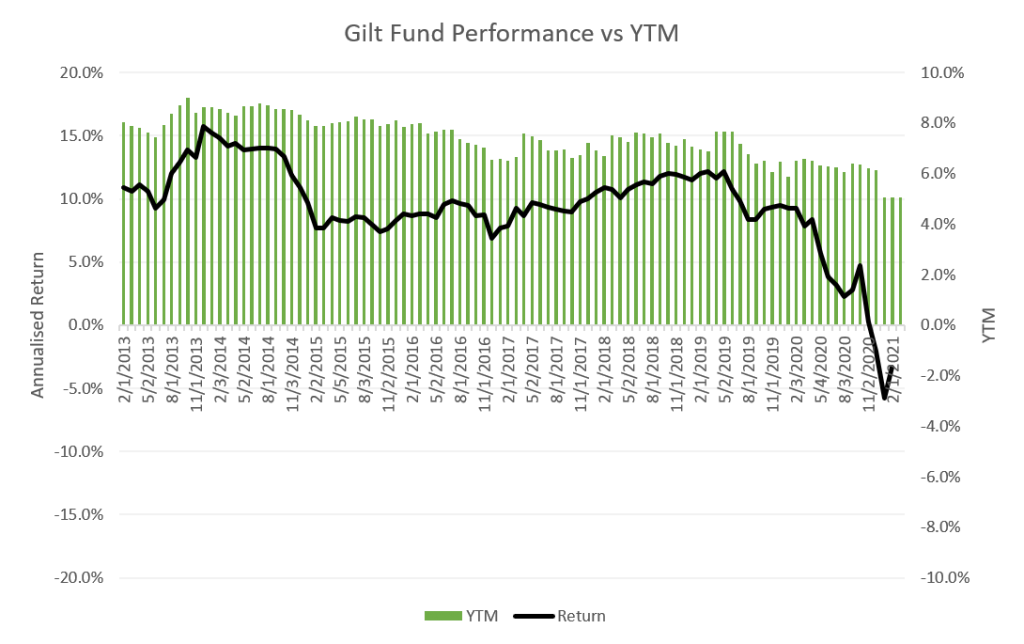
This graph plots the YTM versus the return earned for the category of constant maturity gilt funds. Here also we notice a low correlation between YTM and returns. Data is from February 2018 to February 2021.
Credit Risk Fund Performance Versus YTM
We calculated the returns of credit risk funds from February 2018 till February 2021 as compared with their YTMs. Each dot represents a fund with its YTM and annualised return.
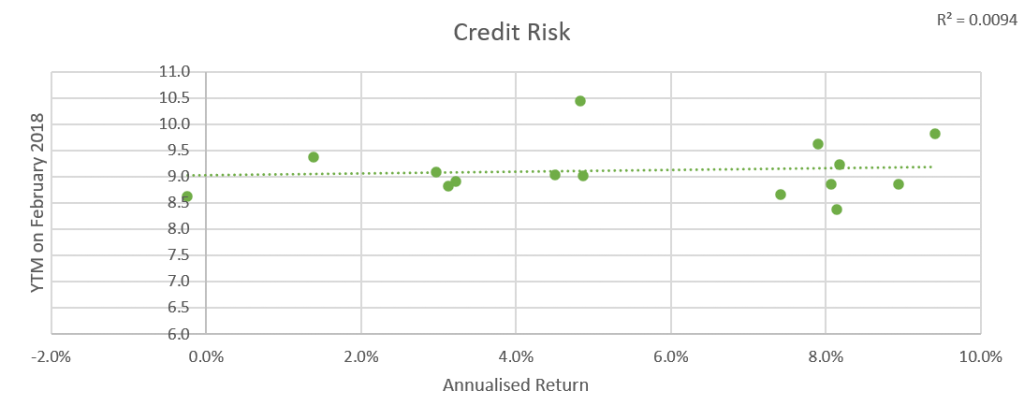
In this instance, the fund offering a 8.5% YTM delivered negative returns. Clearly, yields don’t factor in credit events. Sometimes a high yield reflects high risk and not high return.
Our analysis demonstrates that the YTM does not indicate the return potential. Don’t avoid debt investments solely based on low YTM. Talk to our advisers to find opportunities that work well for you.
Barbell Strategies
A barbell strategy strikes the risk-reward balance by investing in long-term and short-term bonds and bypassing medium-term ones. In today’s context, barbell strategies look attractive because:
-
-
- There’s an attractive spread in the long end curve. 6-9 year G-sec yield is higher than 10-year G-sec.
- Interest rates are likely to rise. Growth and inflation are rising.
- Target maturity/rolldown strategies minimize the risk of MTM loss over the holding period by accruing income.
-
Many Mutual Fund Houses have come up with new target maturity funds. Here’s a quick look at the pros and cons of target maturity strategy:
| Parameter | Pros | Cons |
| Roll down/ Target maturity strategy | No churn/trading on the portfolio; YTM more accurate indicator of returns | MTM loss as the interest rate cycle turns |
| Returns | Accrual income | Don’t capture upside by reinvesting at higher yields |
| Tax efficiency | Indexation benefit; additional 1 year for those who invested before March 31st 2020 | 2020 has been a year of high inflation, indexation starts at a higher base |
| Exit | No exit load | Exiting in between could mean at a lower NAV due to MTM loss |
The target maturity products capture the current opportunity. Could there be a better way to invest in this idea? Absolutely! Talk to our advisers about the barbell SIP – Lower volatility, better risk-adjusted returns!

Perpetual Bonds or AT1 Bonds
What is a Perpetual Bond?
Perpetual bonds are issued by banks and NBFCs. The name indicates that they are “perpetual” in nature and don’t come with a fixed maturity date. Instead, banks and NBFC usually mark a call date – a date on which they have the option, not the obligation, to recall the bonds and fully settle the lenders. Call dates could be anywhere between 3-10 years from the date of issue.
These bonds are issued to protect the bank. They have loss absorption features. We’ve outlined the risks associated with these bonds in a previous piece.
SEBI Circular on AT1 Bonds or Perpetual Bonds
SEBI’s circular on perpetual bonds created a storm for debt mutual funds last month. Here are the top takeaways from the circular and clarifications:
-
-
- Mutual funds must create a provision for segregated portfolios in schemes where they intend to hold perpetual bonds.
- AMC level cap on investments in perpetual bonds is 10%. The scheme level cap is 10%. The issuer level cap is 5%.
- Thinly traded perpetual bonds to be valued on a yield to maturity basis instead of a yield to call basis. The maturity of perpetual bonds to be taken at 100 years.
- 100-year maturity valuation will be implemented in a phased manner. From April 1st, 2021 till March 31st, 2022, perpetual bonds will be valued as 10-year bonds; April 1st, 2022 to September 30th, 2022, they will be valued as 20-year bonds; from October 1st, 2022 until March 31st, 2023 they will be valued as 30-year bonds. Thereafter, they will be valued as 100-year bonds.
- If the issuer (bank) does not exercise the call option, a 100-year valuation applies.
-
YTM (Yield to Maturity) Perpetual Bond
Until this month, perpetual bonds are valued on a yield-to-call basis. This means that they are valued as 3-10 year securities. Switching to a YTM valuation could mean marking down the bond if the maturity is taken at 100 years. This could make the NAVs of certain schemes more volatile because of a change in valuation methods even though the underlying portfolio is the same.
In general, when debt fund NAVs drop, there is a vicious cycle of selling and segregation. This hurts the investors who leave and those who stick on.
As an investor, you’re probably wondering whether to sell your mutual funds or not. Don’t make any decisions in haste. Get an investment review for the following reasons:
-
-
- So far all perpetual bonds have been called back on their call dates
- Skipping a call date will spell trouble for a bank in terms of raising fresh money
- Even with gradual implementation, bond portfolios will be volatile as valuation norms change
- Some perpetual bonds are more risky than others
-
Perpetual Bonds in Debt Mutual Funds
Mutual funds are the biggest buyers of perpetual bonds. Limiting their participation could lower the appetite for perpetual bonds. So, banks that need capital are in a precarious position and may not be able to raise money through perpetual bonds. This is why the Finance Ministry labelled the circular as disruptive. However, the market appetite for perpetual bonds remains strong. Only Mutual Funds are expected to follow this valuation norm. So, if you’re an individual bondholder, nothing has changed for you.
US Federal Reserve Monetary Policy
In March, the Federal Open Market Committee met and announced its monetary policy:
-
-
- Committed to keeping interest rates near zero until 2023
- Asset purchases to continue: $40 bn mortgage-backed securities and $ 80 bn US Treasuries
- Employment remains a focus metric
- Inflation – a spike may not be durable or warrant a change in interest rates.
-
The Fed’s approach and expectations of monetary policy have changed from the last meeting to this one. Here’s a quick comparison of dot plots from December 2020 and March 2021.
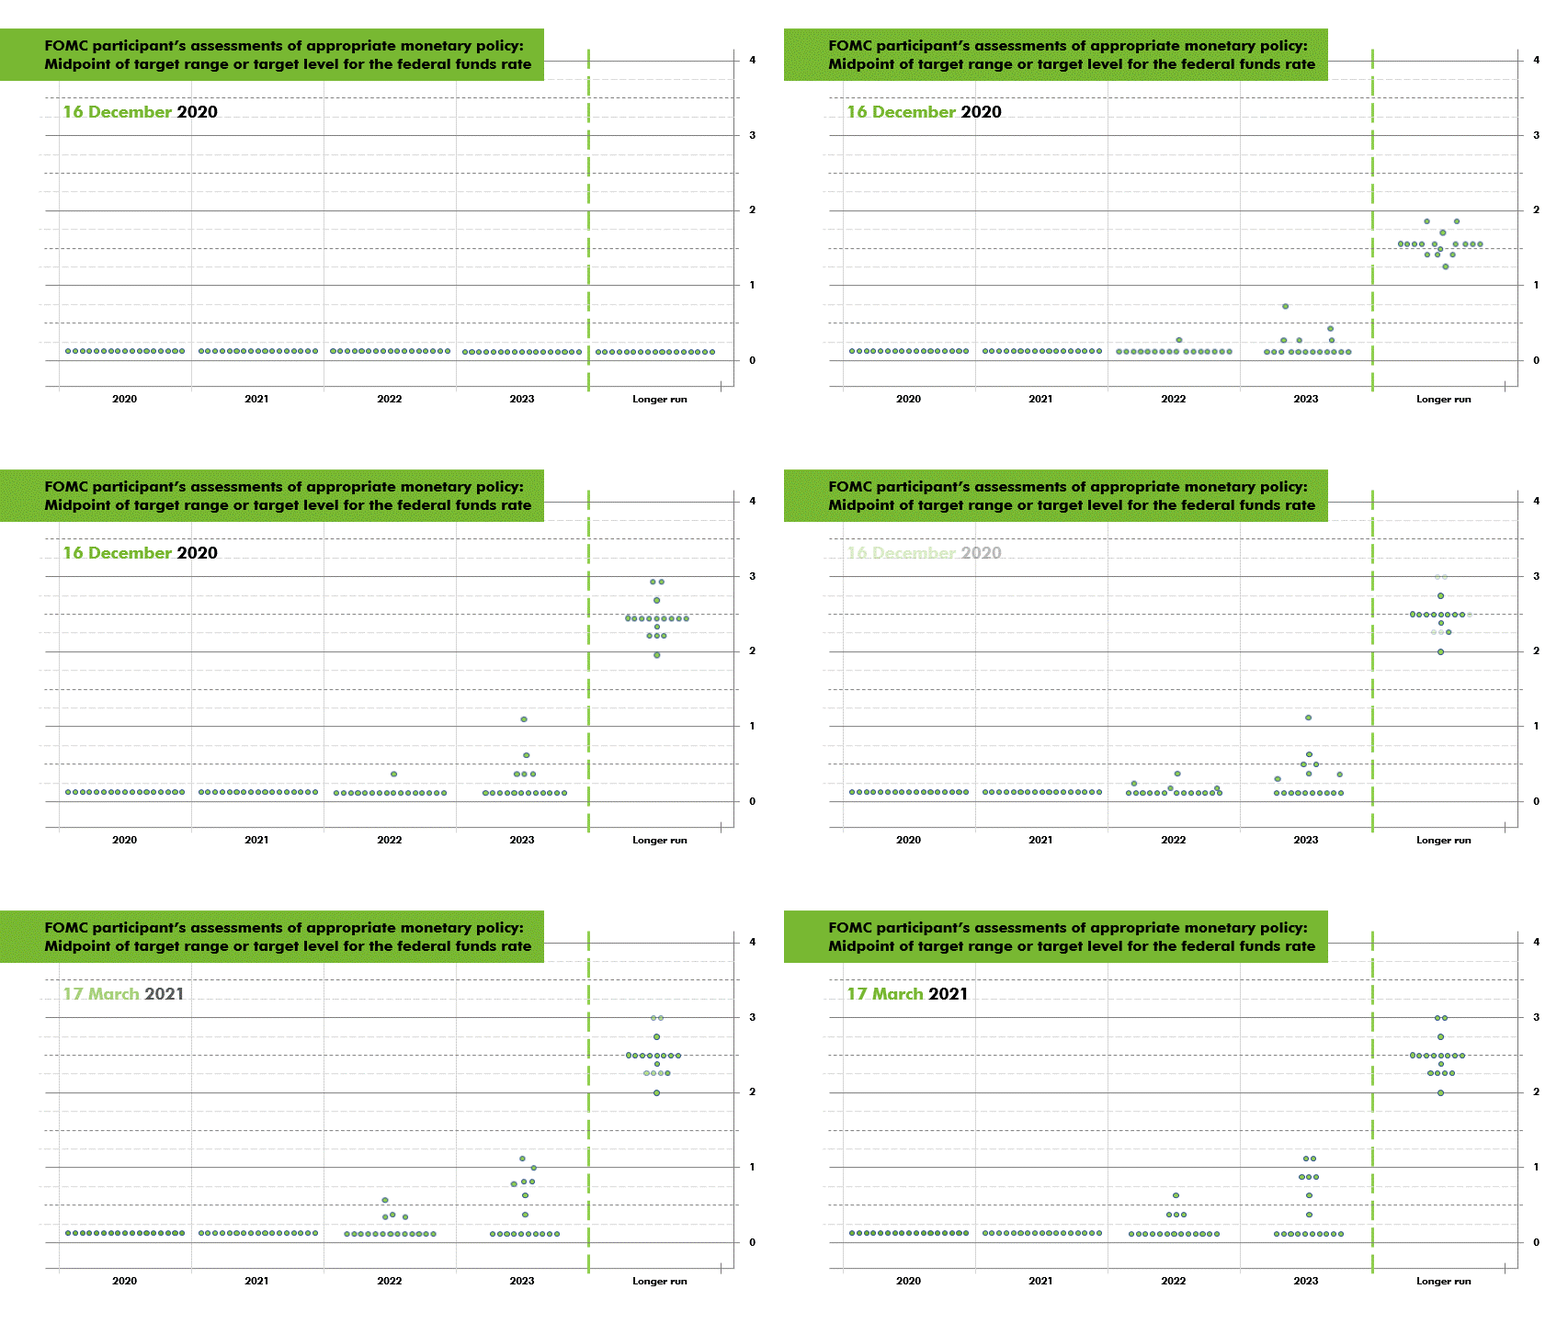
A couple of things are clear. The Fed isn’t worried about inflation. To them, inflation targeting is a long-term objective. So, breaching the 2% limit on a particular month won’t change the course of interest rates. One thing we must remember is pent up demand. Through 2020, many people who didn’t lose jobs received stimulus checks. At the same time, due to lockdowns the avenues to spend money were limited. Eventually, spending has to catch up and this could fuel consumption-related inflation. What the Fed is worried about is employment. Positive growth numbers without an increase in employment is a cause for concern. Higher employment/ workforce participation reflects broader economic recovery.
With the fed laying low, could we be far behind? We’ll know in our next monetary policy scheduled from the 5th to the 7th of April. Stay tuned for our update!