In this month’s fixed income note, we are going to be looking at one of the most significant events that happened in recent times. The ‘Taper Tantrum’ as it is popularly referred to is what happened when the federal reserve ‘tapered’ or slowed down in their quantitative easing. Let us take a deeper dive and see how it went.
A LOOK BACK
In the wake of the great financial crisis of 2008 and the massive unemployment it left in its wake, the federal reserve used their main tool in their monetary policy chest-interest rate cuts. When an economy is in trouble and the growth slows down, central banks traditionally use interest rates as a tool to spur growth. The idea is to lower the cost of borrowing in the economy and spur economic activity. Businesses take on loans/debt to expand, people consume more and therefore, employment increases as businesses take on more capacity. This also raises inflation in a healthy way and helps in recovery. On the other hand, when an economy over-heats, the central bank uses the same tool, but in reverse, increasing the cost of borrowing, gradually applying breaks on the economy so that it does not crash and burn.
The former is what the federal reserve did, starting in 2007 when the economy started slowing down. Early to mid-2007, interest rates were near 5.2%. As the economy went into recession in 2008, the fed had bought interest rates to near 0%. This continued till 2015.
Another tool the federal reserve introduced in this recovery phase from 2009 is this concept called quantitative easing or QE. The central bank increased money supply by conducting asset purchases. This pushed interest rates down. The fed purchased bonds, mortgages, and other financial assets. This increased their asset base while the banks were expected to use the money to lend and stimulate economic growth.
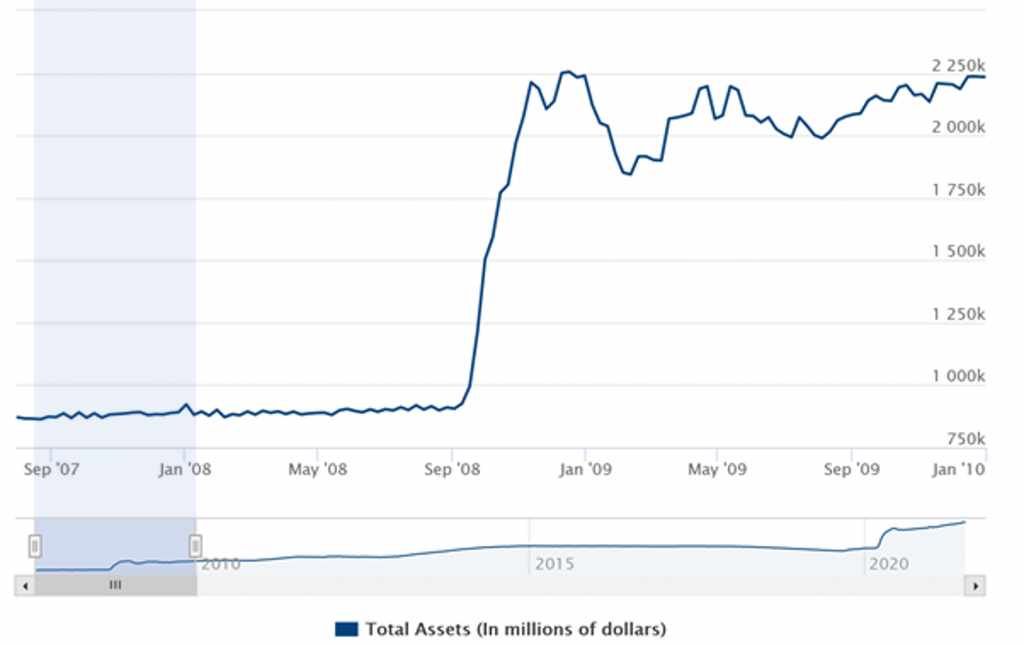
This chart shows how the balance sheet expanded from 2007 to 2010. Their asset size grew almost by 160%. This marked the beginning of quantitative easing, popularly known as QE-1. By 2010, the Fed’s balance sheet had grown to $2 trillion. However, this was not enough to make the banks lend. But it did achieve the goal of lowering interest rates across the curve. QE-2 was announced in 2010. The Fed announced that it would purchase $600 billion of fixed income securities taking the total to $2.6 Trillion. Yet Again, this did not achieve all desired goals. It did not still get the banks to lend, but it did spur inflation and kept interest rates low. It also created an asset bubble in commodities.
QE-3 began in 2012 and was different. This time, monetary policy was set with a target of employment growth. The Fed focused more on job growth than just targeting inflation. They also focused on economic expansion and committed to keep the Fed funds rate at near 0% till 2015 and started Operation Twist. Operation twist is where a central bank buys long-dated fixed income securities and sells short term bills. They also took toxic assets off the member banks’ books by purchasing close to $40 billion in mortgage-backed securities. Together this added close to $85 billion in liquidity.
By the time QE-4 was announced, unemployment was at 7.9% and inflation was below 2%. The Fed bought $85 billion worth of treasury bonds every month. They said they would continue with QE until either unemployment dropped below 6.5% or inflation rose to above 2.5%. Interest rates were kept at 0% till 2015. QE-4 finally got credit growth, creating demand, and boosting the housing market.
THE QE TIMELINE
TAPERING
It was clear that such a large expansion cannot go on forever. Tapering is the term used to refer to the slowdown in bond purchases by the Fed, slowly reducing support. In December 2013, they decided to cut bond purchases by $10 billion a month, reducing purchases to $75 billion a month. A gradual approach was preferred to minimize volatility. Tapering continued and subsequently came to an end, by the end of 2014. This was a signal that the Fed was confident in the strength of the economy. The initial reaction to the talk of a slowdown in bond buying was a temporary sell-off in bonds and there were fears that the stock market might take a hit as well. This is what is referred to as ‘Taper Tantrum’ These fears quickly subsided, and the tapering was smooth and uneventful.
THE CURRENT SITUATION
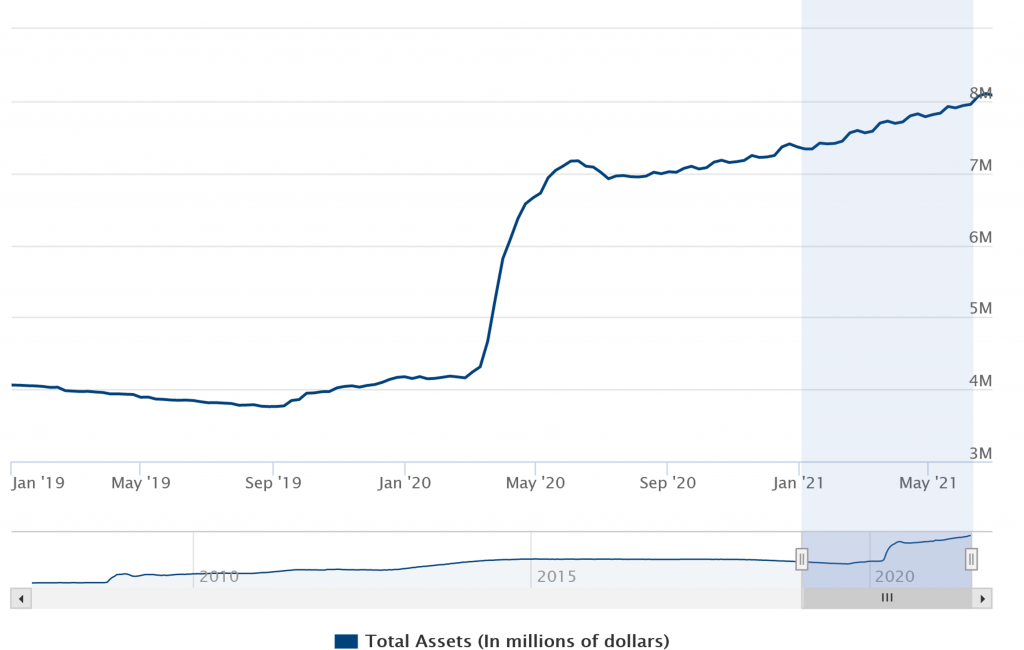
The lockdowns induced by the coronavirus pandemic caused businesses to shut down and a massive rise in unemployment. This prompted the Fed to take massive monetary action as interest rates were again reduced to near 0%. Liquidity was also induced into the system, to the tune of close to $4 trillion, taking the total size of the Fed’s balance sheet to $8 trillion.
The Fed has again taken unemployment as the target and wants to achieve pre-pandemic unemployment rates of 3% from the current 6%. The chairman has also stated that the Fed is okay with inflation rising above the 2% threshold for a longer period before raising rates. They have been re-iterating this stance in subsequent meetings.
They have a flexible mandate that would look at average inflation over a period. The current bond purchase program has $120 billion of liquidity being infused every month across treasuries and mortgage-backed securities. Talks of tapering are yet to start, but as history shows, we should be prepared.
LESSONS FROM LAST TIME
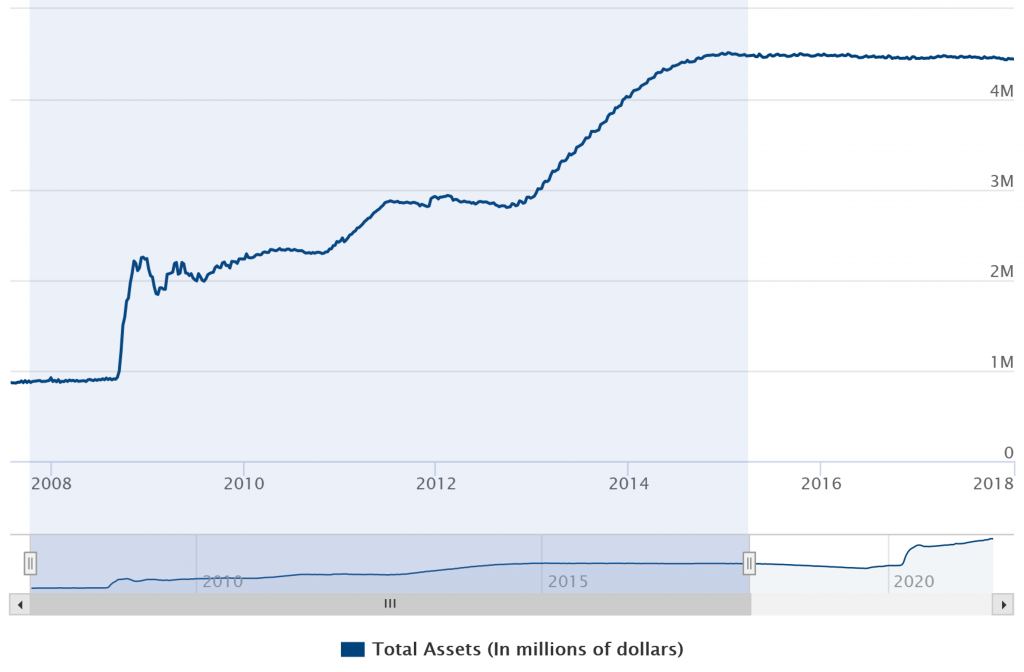
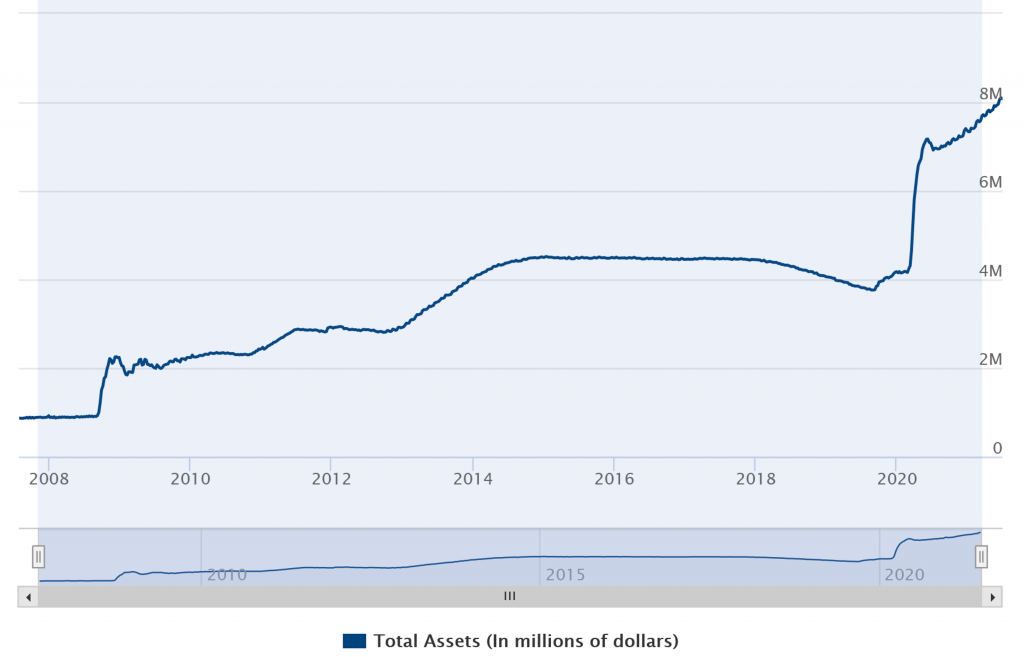
Initially, the markets got jittery but soon realized that tapering need not be a bad thing. It indicates that the central bank is confident that the economy can stand on its own legs without external support. There might be a few hiccups along the way but the destination is a good place. Although I may have left you on a positive note, this does not mean that we cannot throw caution to the winds. To know if your fixed-income portfolio is geared for the uncertainty of the future, get in touch with our advisors today. We close with another chart that shows the incredible expansion of the Federal Reserve’s balance sheet from 2007 to 2021.
REFERENCES:
-
-
- The Balance
- Forbes
- Archives of the Federal Reserve
-